The rise and rise of rooftop solar
By Joshua Stabler – Energy Edge Managing Director
Linked Articles: Orderly Transition: The complex case of residential batteries
NEM Rooftop Solar Conditions
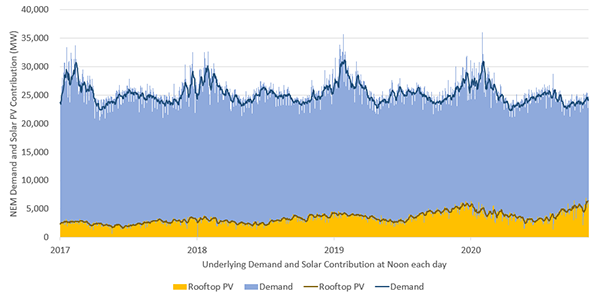
Figure 1: Rooftop Solar Contribution to Total Demand – At Noon
With abundant sunshine as well as rooftops, Australia has pushed the bleeding edge of the rooftop solar with nearly 2.6 million installations (CER). Looking at the NEM wide impact, the consistently rising contribution of rooftop solar to the NEM supply side at noon each day has been illustrated in terms of energy dispatch (Figure 1) and the percentage contribution (Figure 2). The seven day rolling average peaked in recent days in excess of 25% of energy requirements during the middle of the day.
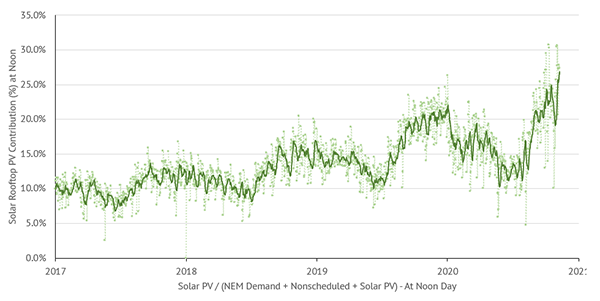
Figure 2: Rooftop Solar Contribution (%) of Total NEM Demand – At Noon
This rapid increase in a non-discretionary supply side generation (i.e. residential solar is unaware of the wholesale market) has impacted the electricity market outcomes. This has been noted in both the solar volume weighted average prices (VWAP) shown in Figure 3 and the dispatch weighted price ratio (Solar VWAP / Demand VWAP) shown in Figure 4. NEM
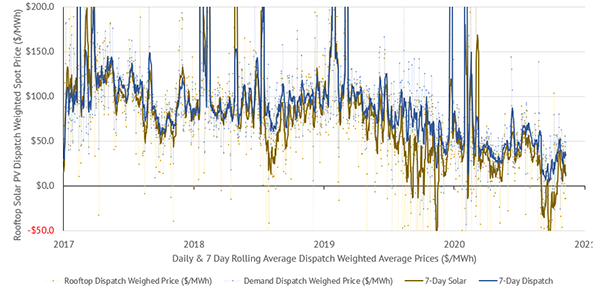
Figure 3: Solar Volume Weighted Average Price (VWAP) vs Demand VWAP – Daily
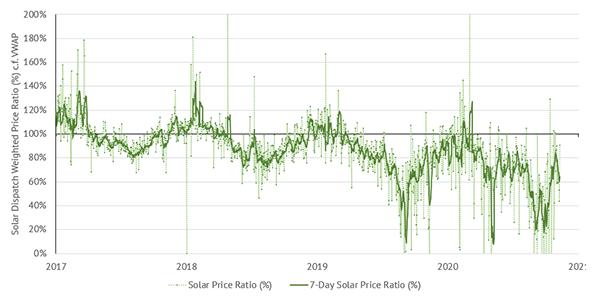
Figure 4: Solar Volume Weighted Average Price (VWAP) as ratio (%) of Demand VWAP – Daily
South Australia Rooftop Solar Conditions
South Australia has pushed the bounds of new renewables (solar and wind) beyond any region in the world, and this is true with residential uptake of rooftop solar. This uptake of rooftop PV has been clearly illustrated in terms of rooftop energy dispatch (Figure 5) and rooftop energy % contribution (Figure 6), where it has recently topped out at more than 75% of the local demand.
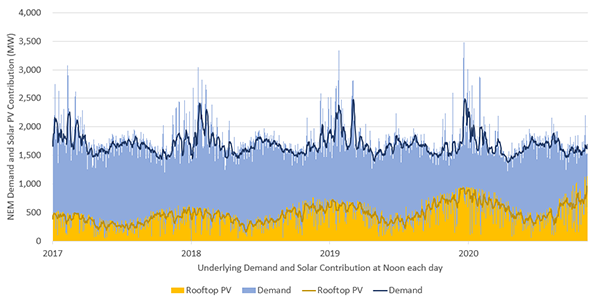
Figure 5: South Australia Rooftop PV Contribution (MW) to Regional Demand – At Noon
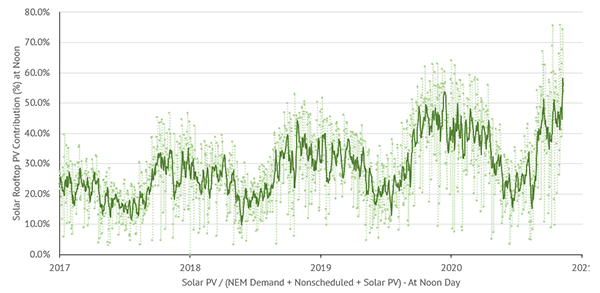
Figure 6: South Australia Rooftop PV Contribution (%) to Regional Demand – At Noon
The sharp increase on the supply side has resulted in consistently negative price outcomes during the September – October milder weather shoulder periods as noted in Figure 7.
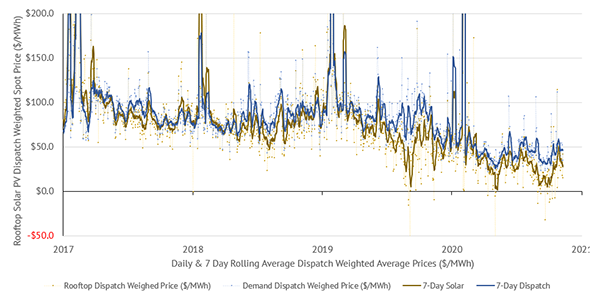
Figure 7: South Australia Volume Weighted Average Price (WVAP) vs Regional VWAP – Daily
In fact, during the 43 days between 29 August and 10 October 2020, there was only 17 days were the average solar dispatch price was positive (Figure 7). That is, during the 26 other days, the average dispatch price for rooftop solar was (negative) -$51.1/MWh.
Even over the past twelve months which allows for the peak summer and winter periods, the volume weighted dispatch spot price of the rooftop solar in South Australia has only averaged $37.40/MWh ($0.037 /KWh), while the regional VWAP has been $57.98/MWh.
It should be noted that the solar feed-in is further concentrated to the middle of the day when in-house consumption is lower, allowing more solar to be exported… which coincides with the lowest prices.
This does not bode well for the future fair-value price of rooftop solar exports to the market for all residentials (i.e. Feed-in Tariffs) for either South Australia, or anywhere in Australia.